Flowchart is one of the three basic documents created by a production plant during pre-launch phase. Two others are Control Plan and PFMEA. Additionally, it is one of the seven basic quality tools. It is also called a process diagram or process flow diagram.
Flowchart is one of the three basic documents created by a production plant during the pre-launch phase. The other two are the Control Plan and PFMEA. Additionally, it is one of the seven basic quality tools.
It is also called a process diagram or process flow diagram.
A flowchart is a versatile tool that can be customized for many different purposes. It can be used to describe various processes, such as manufacturing or project planning. It is also a common tool for process analysis.
The elements that can be included in a flowchart are the sequence of activities, materials or services entering or leaving the process (inputs and outputs), decisions that must be made, involved people, time spent on each step, and process measurements. It shows the various steps of the process in sequential order.
Flowchart – When to Apply
In the automotive industry, the answer is straightforward: a flowchart is always used together with the Control Plan and PFMEA. During Advanced Product Quality Planning (APQP), the first version of the flowchart is prepared in the first phase of APQP: “I. Product Planning and Quality Program Definition”.
However, the final version should be created in phase “III. Process Design and Development”.
Depending on the required level of part submission for approval by the PPAP/PPA/PE customer, this version of the diagram should be considered.

Additionally, flowcharts are used for:
- Understanding how the process works
- Studying potential process improvements
- Communicating the process to others (including customer representatives)
- Improving communication between team members involved in the same process
- Documenting the process during project planning
Flowchart – Basic Symbols
![]() – Process Element: Described in a rectangle, with usually only one arrow exiting.
– Process Element: Described in a rectangle, with usually only one arrow exiting.
![]() – Flow Direction: Indicates the direction of flow from one step or decision to another.
– Flow Direction: Indicates the direction of flow from one step or decision to another.
![]() – Decision Gate: Based on a question, placed in a diamond. Multiple arrows emerge, each pointing to the direction the process follows based on the answer (“yes” or “no”).
– Decision Gate: Based on a question, placed in a diamond. Multiple arrows emerge, each pointing to the direction the process follows based on the answer (“yes” or “no”).
![]() Delay or Waiting: Represents a delay in the process.
Delay or Waiting: Represents a delay in the process.
![]() – Link to Another Page/Flowchart: Indicates that the flow continues on another page or diagram.
– Link to Another Page/Flowchart: Indicates that the flow continues on another page or diagram.
![]() – Input or Output: Represents the input or output of the process.
– Input or Output: Represents the input or output of the process.
![]() – Manual Operation: Represents manual operations within the process.
– Manual Operation: Represents manual operations within the process.
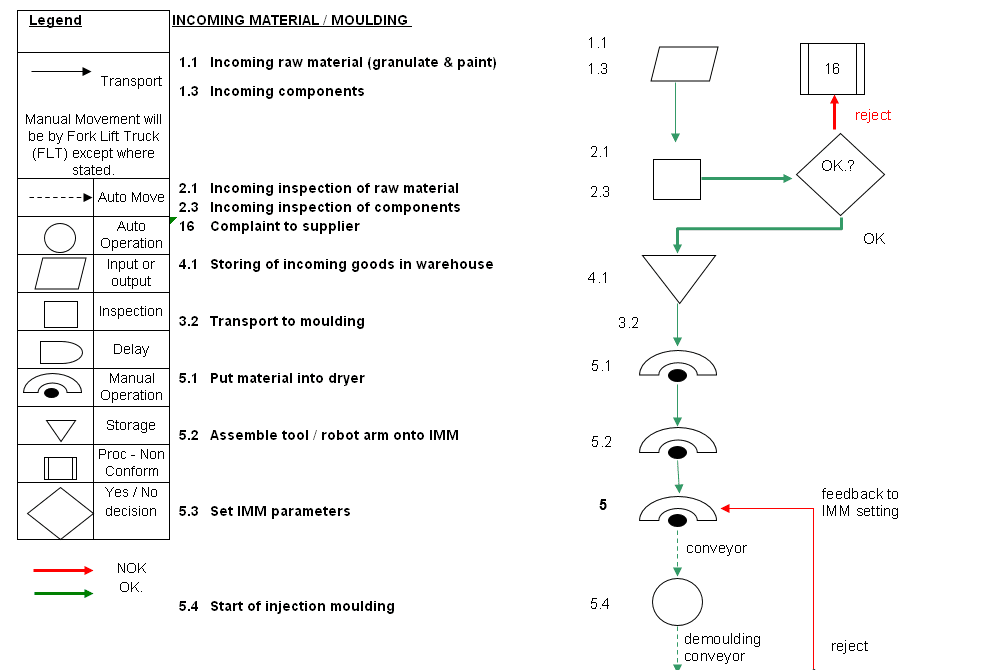
An example of the above symbols’ application is shown below.
Additional Customer Requirements to Consider
When defining a flowchart, customers (OEMs) often require that operations involving safety characteristics are distinctly marked compared to other processes.
Additionally, when considering repair or rework operations (see IATF requirements 8.7.1.4 and 8.7.1.5 on control of reworked and repaired products), a feedback loop should be included in the flowchart, showing where the product will be repaired or reworked and then reverted to the standard production process.
Another element to include is information about production processes carried out outside the production plant, such as painting, carburizing, galvanizing, and hardening.
Don’t forget to consider the Customer Specific Requirements (CSRs).
You can download an automatic, editable Excel form for free on Free Quality Tools
Document name: Process Flow Diagram – Excel form
Author: Dariusz Kowalczyk